Low Supply and Multiple Bids
Market Times have dropped like a rock since the start of the year, squeezed by not enough sellers.
In-N-Out has arguably the best cheeseburger. What started in Los Angeles has spread to nearly 400 locations in five states. They are also known for their long drive-thru lines. To avoid the long wait, many hungry, wise hamburger connoisseurs head over at a more favorable time, like 3 p.m. Unfortunately, to their surprise, they are greeted by an unexpected mile-long line.
Many buyers have a similar experience as they dive into today’s housing market. After hearing about falling home prices due to sky-high mortgage rates, they expect housing to be slow so they can take their time and not compete in purchasing a home. Instead, they are experiencing long lines of buyers at open houses and multiple offers on homes priced right and in reasonably good condition. Home buyers are frustrated once again.
Ever since mortgage rates climbed above 6% in June, there has been a tug-of-war taking place between buyers and sellers: low demand, which favors buyers, pit against a low supply, which favors sellers. Last year, inventory kept growing until it peaked in August, while demand continued to drop after peaking in March with rising rates. Market times rose from 19 days in March to 56 days in June to 67 days in July. By November, the market time reached 84 days, drastically different than the first five months of the year. As market times grew, buyers had the upper hand. The pool of buyers evaporated due to affordability constraints. The remaining buyers were not tripping over each other to purchase, they were unwilling to overpay for a home, and the few houses on the market took longer to sell. The sense of urgency that characterized the market from June 2020 through May 2022 had vanished. According to the Freddie Mac House Price Index, as of January, San Diego County has dropped 10% since May and was down 4% year-over-year.
In January 2022, there were 1,500 homes available, and demand, the last 30 days of pending sales activity, was at 1,744. Demand was higher than the supply of available homes, and the market time was less than 30 days for all of San Diego County. It was insanely hot, with way too much buyer competition, multiple offers, and sales prices way above the asking prices. With rising rates, the supply increased rapidly while demand was falling. In May, demand was less than the supply, which is normal. The difference between supply and demand grew. At the end of October 2022, demand dropped to 1,596 pending sales, and the inventory had reached 4,433. Supply was 2,837 higher than demand, the largest gap in 2022.
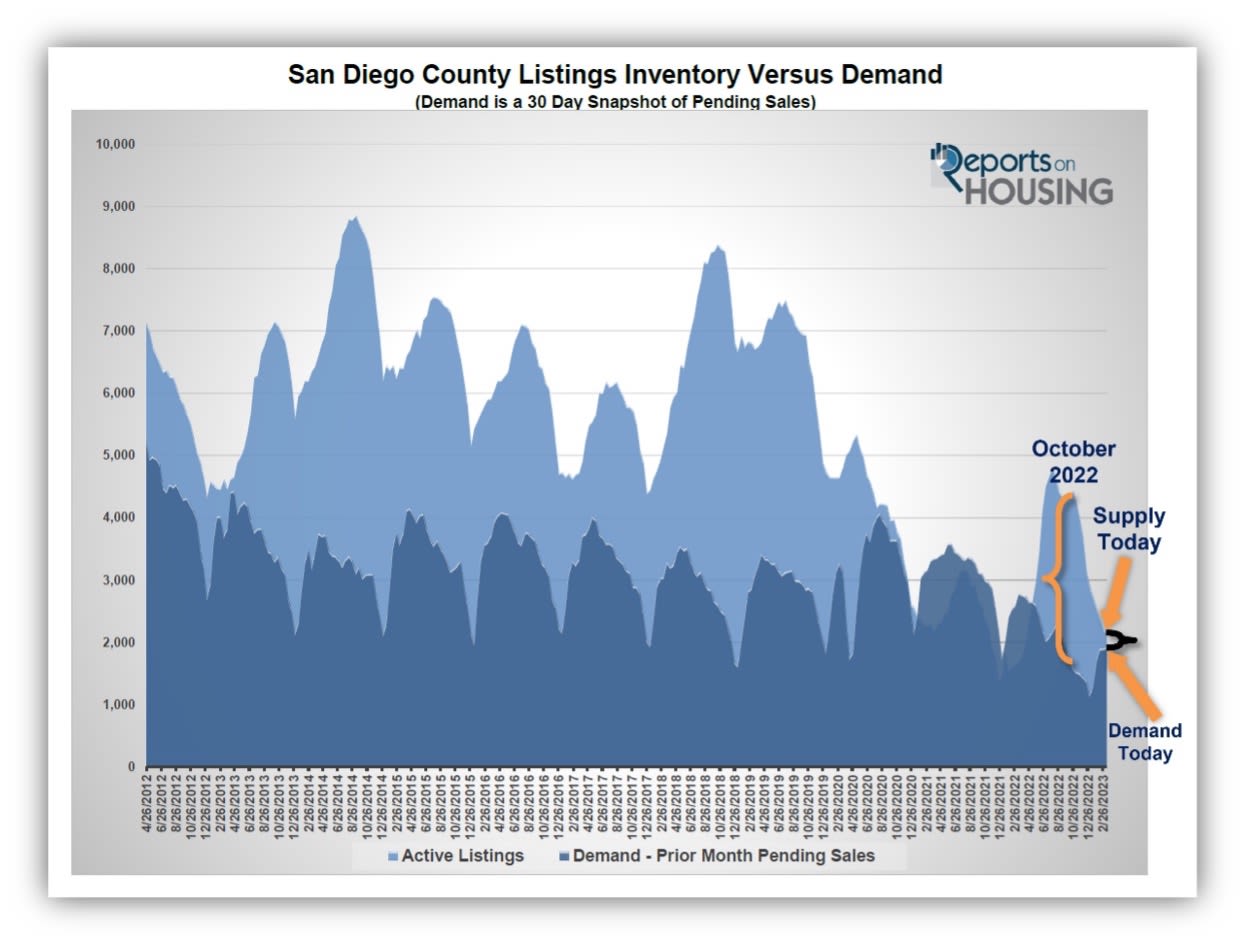
The housing market has evolved yet again in 2023. The supply of available homes has been dropping while buyer demand has risen. The inventory declined from 2,898 homes in January to 2,164 today, a drop of 25%. On the other hand, demand has grown from 1,144 pending sales in January to 1,913 today, up 67%. The difference between supply and demand has diminished from 1,754 in January to 251 today, its smallest difference since May last year. The market time dropped from 76 days in January to 34 days today, its lowest level since May 2022. Anything below 50 days indicates that not enough homes are available to purchase.
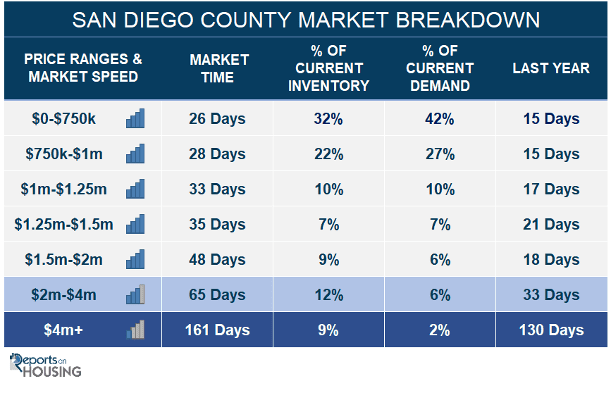
Two-thirds of San Diego County cities have an Expected Market Time of less than 50 days. Rancho Peñasquitos has the lowest market time at 12 days, with only 10 available homes and demand at 26 pending sales. All homes below $2 million have a market time below 50 days. The fastest price ranges are homes between $500,000 to $750,000 at 21 days, and between $750,000 and $1 million at 28 days.
At 34 days, San Diego County buyers are once again experiencing long lines of buyers at open houses, multiple offer situations, and sales prices above the asking price. This is not due to heightened demand. High mortgage rates are inhibiting demand. Instead, it is a result of not enough new sellers and a muted inventory. So far this year, in January through February, there have been 3,948 missing FOR-SALE signs compared to the 3-year average before COVID (2017 to 2019), down 48%. Today’s buyers cannot buy what is not for sale, so buyers in today’s marketplace are waiting for homes to be placed on the market. As soon as a home becomes available, if it is in decent shape and priced right, it will be greeted with plenty of buyer traffic and interest.
Note to sellers: This is NOT the insane market from June 2020 to May 2022, where values were screaming higher. Sellers may have the advantage, but overpricing a home is futile. Homes with deferred maintenance or a poor location will be extremely challenging to sell without adjusting the price. Price a home according to its Fair Market Value based on condition, location, upgrades, amenities, and age. Multiple offers may be back, but sellers should not get overzealous.
Active Listings
The active inventory continued to fall, declining by 2% in the past couple of weeks.
The active listing inventory decreased by 52 homes in the past two weeks, down 2%, and now sits at 2,164 homes, its lowest level since April last year. Typically at this time of year, the inventory rises by 1%. The Spring Market has arrived. The Spring Market is characterized by an increasing inventory. The 3-year average rise before COVID (2017 to 2019) was 15% from now through the end of May. But this year is far from average, with 48% fewer sellers so far this year compared to the 3-year average. Based on the first 11 weeks of the year, the inventory will have a tough time rising, similar to what occurred in 2021.
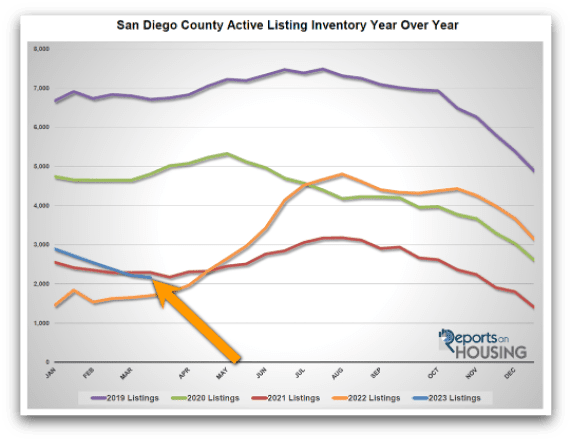
Last year, the inventory was 1,702, 21% lower, or 462 fewer. The 3-year average before COVID (2017 through 2019) is 5,598, an additional 3,434 homes, or 159% extra, more than double today.
Homeowners continue to “hunker down” in their homes, unwilling to move due to their current underlying, locked-in, low fixed-rate mortgage. The difference between their underlying rate and today’s prevailing rate is significant and precludes many homeowners from listing their homes for sale and moving to another house. This will continue until mortgage rates drop. For February, 2,063 new sellers entered the market in San Diego County, 1,842 fewer than the 3-year average before COVID (2017 to 2019), 47% less. These missing signs counter any potential rise in the inventory.
Demand
Demand increased by 1% in the past couple of weeks.
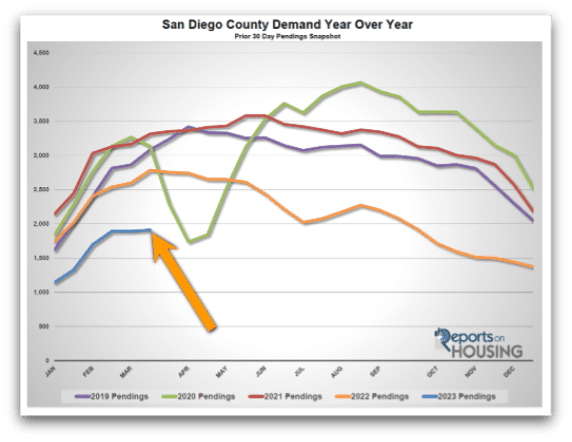
A snapshot of the number of new escrows over the prior month, demand, increased from 1,893 to 1,913 in the past couple of weeks, up 20 pending sales, or 1%, its highest level since September of last year. This is still the lowest level for this time of year since tracking began in 2012. With the arrival of the Spring Market, demand typically continues to rise and peaks sometime between April and mid-May. If rates remain where they are today or go lower, demand will rise along with the increased supply. In San Diego County, the sixth most homes come on the market in March, the fifth most are in April, and May is the number one month for new sellers. Even with fewer sellers due to the hunkering down effect, the number of new sellers entering the fray will increase from here, so expect demand to rise.
Last year, demand was at 2,785, 46% more than today, or an extra 872. The 3-year average before COVID (2017 to 2019) was 3,227 pending sales, 69% more than today, or an additional 1,314.
With increased demand and a falling supply, the Expected Market Time (the number of days to sell all San Diego County listings at the current buying pace) decreased from 35 to 34 days in the past couple of weeks, its lowest level since May 2022. At 34 days, the market is hotter than the 76-day level to start the year, but this is more of a function of a lack of supply and not record-breaking demand. Last year the Expected Market Time was 18 days, substantially faster than today, and home values were screaming higher. The 3-year average before COVID was 52 days, a slower pace than today.
Luxury End
The luxury market slowed slightly over the past couple of weeks.
In the past couple of weeks, the luxury inventory of homes priced above $1.5 million decreased from 649 to 646 homes, down 3 homes, nearly unchanged. Luxury demand decreased by 21 pending sales, down 7%, and now sits at 277. With demand falling and supply unchanged, the overall Expected Market Time for luxury homes priced above $1.5 million increased from 65 to 70 days. The San Diego luxury market is the hottest in all of SoCal. At 70 days, it may not be as hot as most of 2021 and the first half of 2022, but it is still a ferocious pace for luxury.
Year over year, luxury demand is down by 100 pending sales or 27%, and the active luxury listing inventory is up by 201 homes or 45%. Last year’s Expected Market Time was 35 days, an insane velocity for luxury.
For homes priced between $1.5 million and $2 million, the Expected Market Time in the past two weeks increased from 41 to 48 days. For homes priced between $2 million and $4 million, the Expected Market Time decreased from 68 to 65 days. For homes priced above $4 million, the Expected Market Time increased from 149 to 161 days. At 161 days, a seller would be looking at placing their home into escrow around August 2023.