Lack of FOR-SALE Signs
Since the pandemic, there have not been enough homes available, and 2023 is no different.
The pandemic lockdowns began three years ago, in March 2020. Life came to an abrupt halt. Instantly, grocery shelves were ransacked as everyone prepared for an indefinite time in their homes. Many aisles were empty, most notably the toilet paper aisle. There was a run on toilet paper, and it lasted throughout 2020. In desperation, people resorted to shopping for rolls on eBay or Amazon and were willing to pay whatever price. It was simple supply and demand.
Similarly, the housing shelves have been seemingly empty since entering the pandemic, with very few homes available compared to pre-COVID inventory levels. In 2020 and 2021, fewer homeowners opted to sell their homes amid the pandemic. San Diego County had 9% fewer sellers in 2020 compared to the 3-year average before COVID-19 (2017 to 2019), or 4,800 less. In 2021, it rose to 14%, or 7,600 missing sellers. Surging demand had an even more significant impact on shrinking the supply of available homes. From March 2020 to January 2021, rates reached 17 record lows. As rates plummeted, demand surged. As a result, the inventory reached record lows in 2020 and 2021.
The inventory finally began to rise in 2022 as rates soared from 3.25% at the start of the year to the mid-5s in June and July. Yet, rates rose further, surpassing 6% in September and 7% in October. Since 89% of all Californians have rates at or below 5% and 71% have rates at or below 4%, only some homeowners have been willing to give up their incredibly low fixed-rate mortgages and sell their homes. This “hunkering down” effect has resulted in a growing number of homeowners staying put. In 2022, there were 13,800 fewer sellers, 26% less.
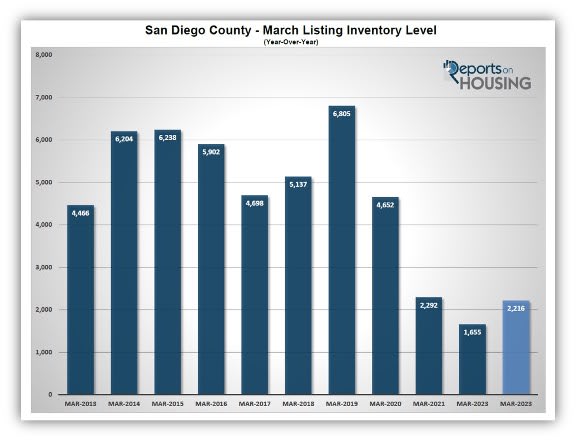
Today, there are only 2,216 homes available to purchase in all of San Diego County. There were 1,655 last year, catastrophically low and 25% lower than today. In 2021, there were 3% more. The marketplace is complaining about a lack of supply, just like they did in March 2021 and 2022. The lowest level by far before COVID was achieved in 2013 at 4,466 homes. That was 102% higher than the current level, more than double. The 6-year average from 2014 to 2019 for this time of year was 5,831 homes, an additional 3,615, or 163% extra. The current inventory level remains severely low.
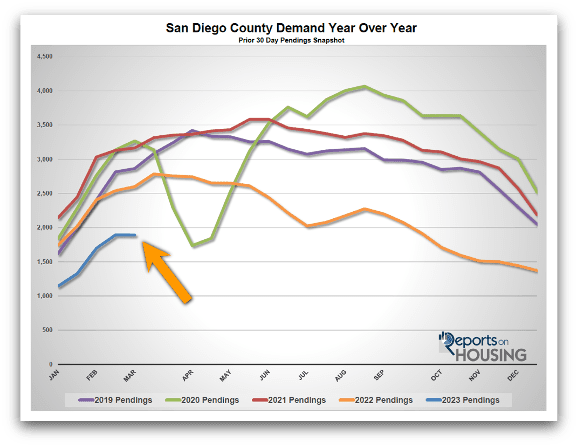
Current demand levels are at Great Recession levels. Today’s demand, a snapshot of the last 30 days of pending sales activity, is at 1,893. Last year demand was at 2,599, or 37% higher. The 3-year pre-pandemic average is 3,045, or 61% higher. Yet, even with ultra-low demand, in matching it up against today’s ultra-low inventory, the San Diego County housing market is extremely hot. The Expected Market Time, the time between coming on the market and pending status, is at 35 days. While not as hot as last year’s 19-day reading, it is considerably lower than the 3-year pre-COVID average of 55 days.
Home values had declined after peaking in May of last year. According to the Freddie Mac Home Price Index, values in the San Diego County region have dropped 9.7% since May. From June 2022 to January 2023, the Expected Market Time averaged 68 days. It was 76 days to start the year. However, in dropping to today’s 35-day level, home values are rising in many areas and price ranges due to the lack of supply. Open Houses are once again crowded with prospective buyers. Many homes are obtaining multiple offers and are selling above their asking prices. That is despite today’s 6.99% interest rate (Mortgage News Daily).
Sellers need to be careful in navigating today’s housing market. Homes priced according to their Fair Market Value and decent condition will procure plenty of activity and, in many cases, obtain multiple offers. But homes in poor shape with plenty of deferred maintenance, houses with an inferior location, and overpriced homes will sit on the market without success even with today’s hotter market time readings.
Like the empty shelves in grocery stores at the start of the pandemic, there are not enough choices for buyers looking to secure a home in today’s housing market. Even with far fewer buyers willing to participate due to higher mortgage rates, the housing scene feels exceptionally hot because of the supply dilemma.
Active Listings
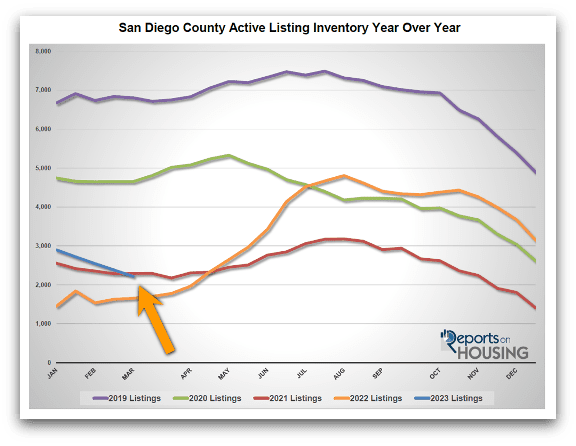
The active inventory continued to fall, declining by 7% in the past couple of weeks.
The active listing inventory decreased by 166 homes in the past couple of weeks, down 7%, and now sits at 2,216 homes, its lowest level since April last year. With the Spring Market right around the corner, from mid-March to the end of May, the inventory typically rises at this time of year. The 3-year pre-pandemic average rise (2017 to 2019) was 1.4% and not a 7% drop. The inventory is falling, and it is not due to a sharp increase in demand. Instead, not enough homes are coming on the market thus far this year. In January, there were 49% fewer sellers, 2,107 less, that came on the market compared to the 3-year average, and in February, it was off by another 47%, or 1,842 fewer sellers. That is nearly 4,000 fewer FOR-SALE signs in just two months, already close to all of 2020. It is 29% of the 13,800 missing signs in 2022. Expect more homes to come on the market during the spring, but at a subdued rate due to the high mortgage rate environment and homeowners opting to stay in their homes and not sell.
Last year, the inventory was 1,655, 25% lower, or 561 fewer. The 3-year average before COVID (2017 through 2019) is 5,547, an additional 3,331 homes, or 150% extra, more than double today.
Demand
As rates increased in the past month, demand stopped surging and remained unchanged in the past couple of weeks.
Demand, a snapshot of the number of new escrows over the prior month, decreased from 1,894 to 1,893 in the past couple of weeks, down 1 pending sale, nearly unchanged. This is the lowest level for this time of year since tracking began in 2012. Typically, demand is slowly rising to start the month of March. With rates increasing from 5.99% a month ago to 6.99% today (Mortgage News Daily), many buyers are again being priced out of the market and sitting on the sidelines, hoping that rates will drop again. Usually, demand rises from here at a faster pace until peaking sometime between mid-April to the end of May. The path of mortgage rates will dictate how the Spring Market unfolds. At this point, it looks like it will be subdued with an anemic number of homes available to purchase, fewer sellers coming to market, and higher mortgage rates due to a steady stream of hotter-than-expected economic readings, counter to the Federal Reserve’s objective in reducing inflation.
Last year, demand was at 2,599, 37% more than today, or an extra 706. The 3-year average before COVID (2017 to 2019) was 3,045 pending sales, 61% more than today, or an additional 1,152.
With the inventory falling and demand unchanged, the Expected Market Time (the number of days to sell all San Diego County listings at the current buying pace) decreased from 38 to 35 days in the past couple of weeks, its lowest level since May 2022. At 35 days, the market is hotter than the 76-day level to start the year, but this is more of a function of a lack of supply and not record-breaking demand. Last year the Expected Market Time was 19 days, substantially faster than today, and home values were screaming higher. The 3-year average before COVID was 55 days, a slower pace than today.
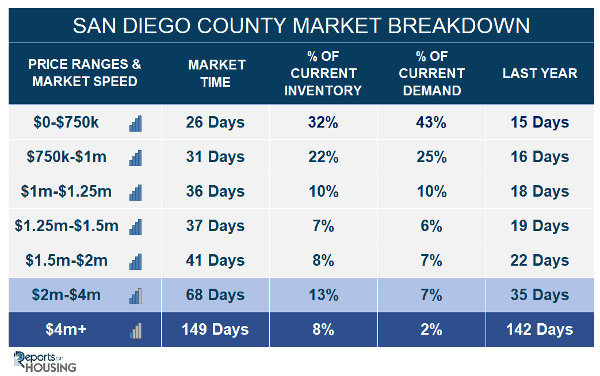
Luxury End
The luxury market continued to improve over the past couple of weeks.
In the past couple of weeks, the luxury inventory of homes priced above $1.5 million decreased from 662 to 649 homes, down 13 homes or 2%. Luxury demand increased by 20 pending sales, up 7%, and now sits at 298, its highest level since July 2022. With demand surging higher and the supply falling, the overall Expected Market Time for luxury homes priced above $1.5 million decreased from 71 to 65 days, its lowest level since last May. The San Diego luxury market is the hottest in all of SoCal. At 65 days, it may not be as hot as most of 2021 and the first half of 2022, but it is still a ferocious pace for luxury.
Year over year, luxury demand is down by 45 pending sales or 13%, and the active luxury listing inventory is up by 200 homes or 45%. Last year’s Expected Market Time was 39 days, an insane velocity for luxury.
For homes priced between $1.5 million and $2 million, the Expected Market Time in the past two weeks decreased from 43 to 41 days. For homes priced between $2 million and $4 million, the Expected Market Time decreased from 79 to 68 days. For homes priced above $4 million, the Expected Market Time decreased from 171 to 149 days. At 149 days, a seller would be looking at placing their home into escrow around August 2023.